INTERACTIONFQM

Business reports

Monitor revenue, demand, team performance and costs from a phone or computer, for one venue or your whole chain.

What it brings to your venue

Reports bring operational metrics together and help you discuss decisions using your venue’s data.

For owners

Compare periods and locations, view data on your phone and export the metrics you need.

For guests and your team

Managers see results, while employees can work with the reports available to them.

How it works

  1. Select a location and reporting period

  2. Review sales and payments

  3. Explore individual dishes or shifts

  4. Export data or set up a report

Module features

Revenue, orders and payments

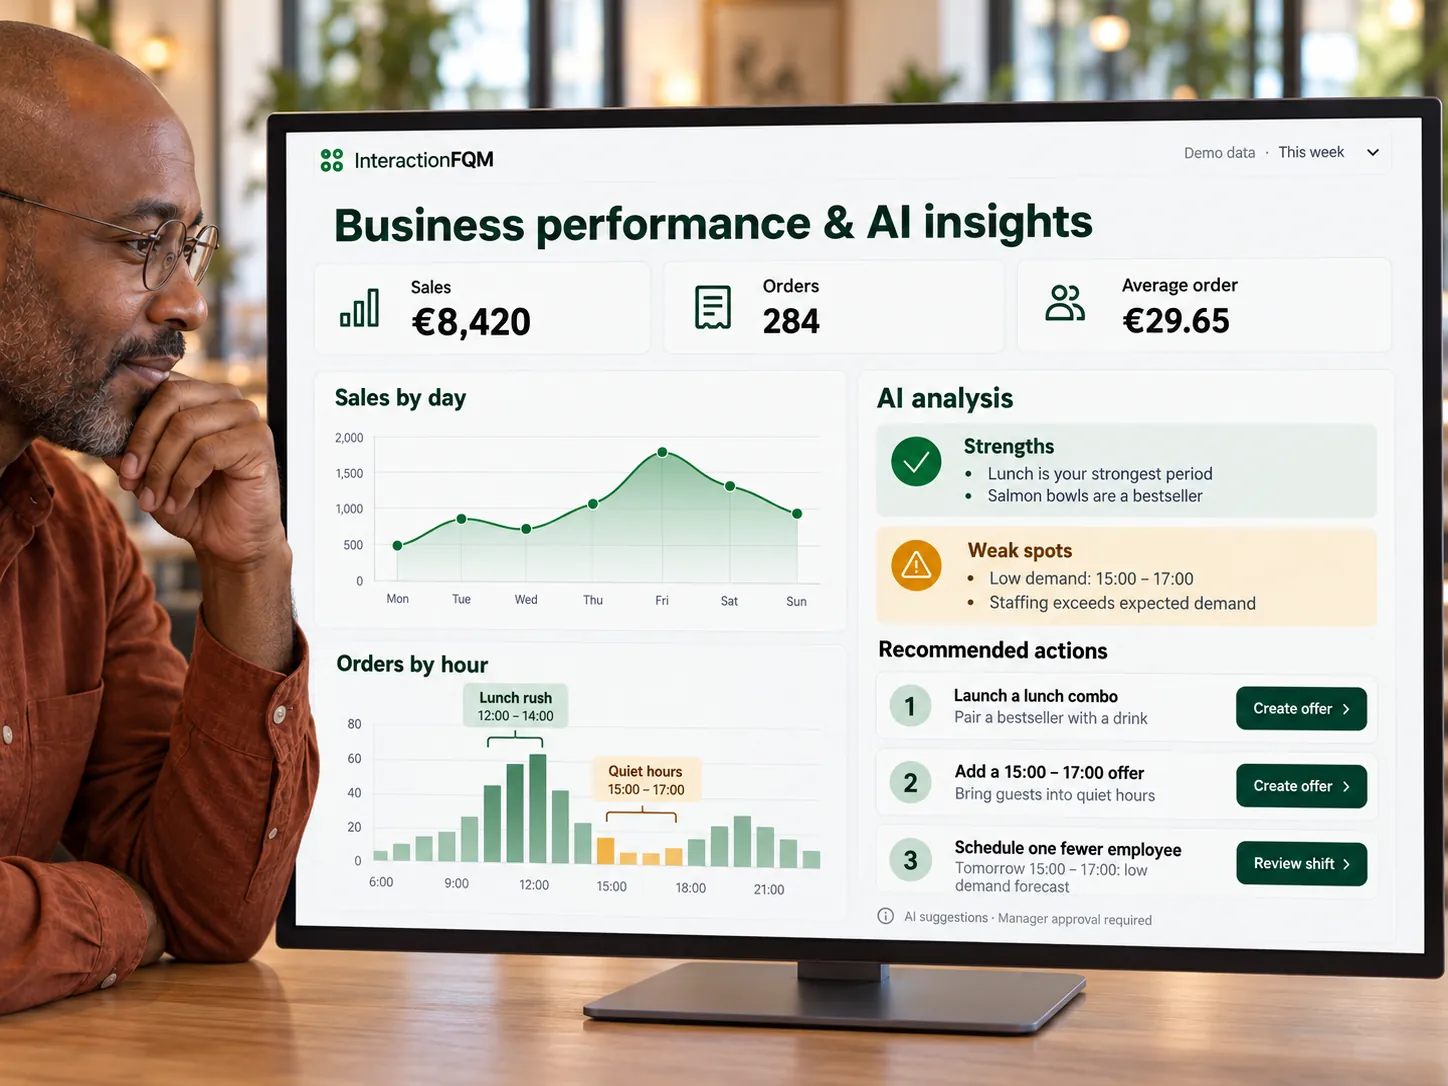
  • Dashboard: revenue excluding tips, order count, average order value and the share of bills paid
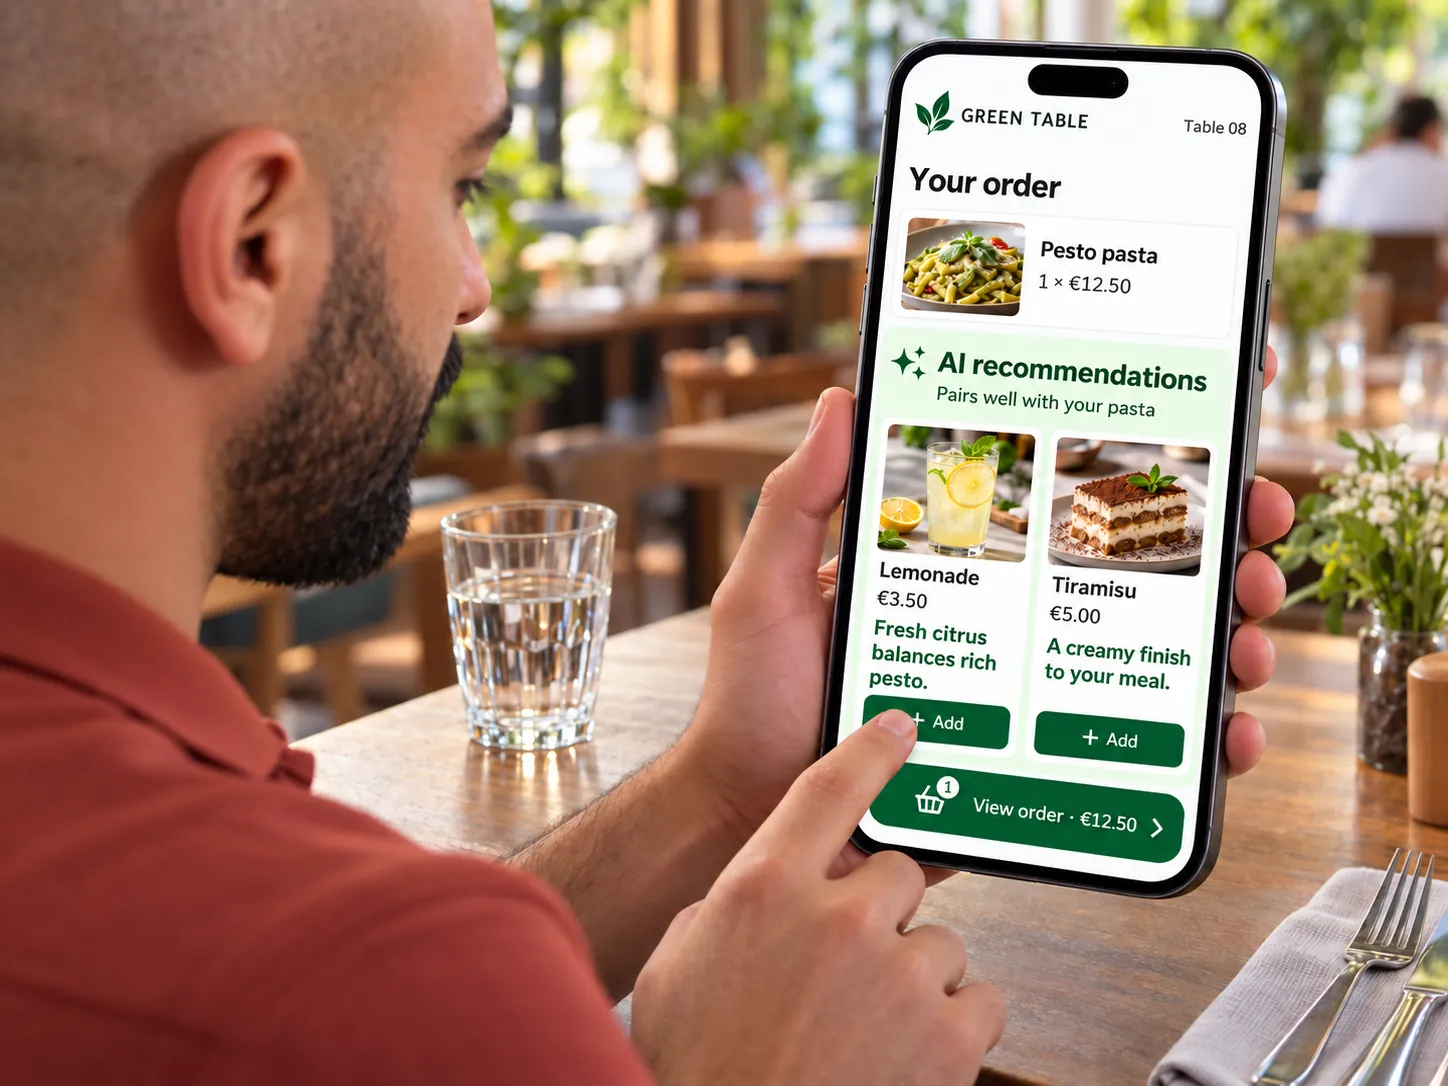
  • Order sources: guest QR menu, waiter, till and website collection orders
  • Payment methods and cash in the till
  • Refunds in shift reports and on the dashboard
  • Cancellation report

Team and service

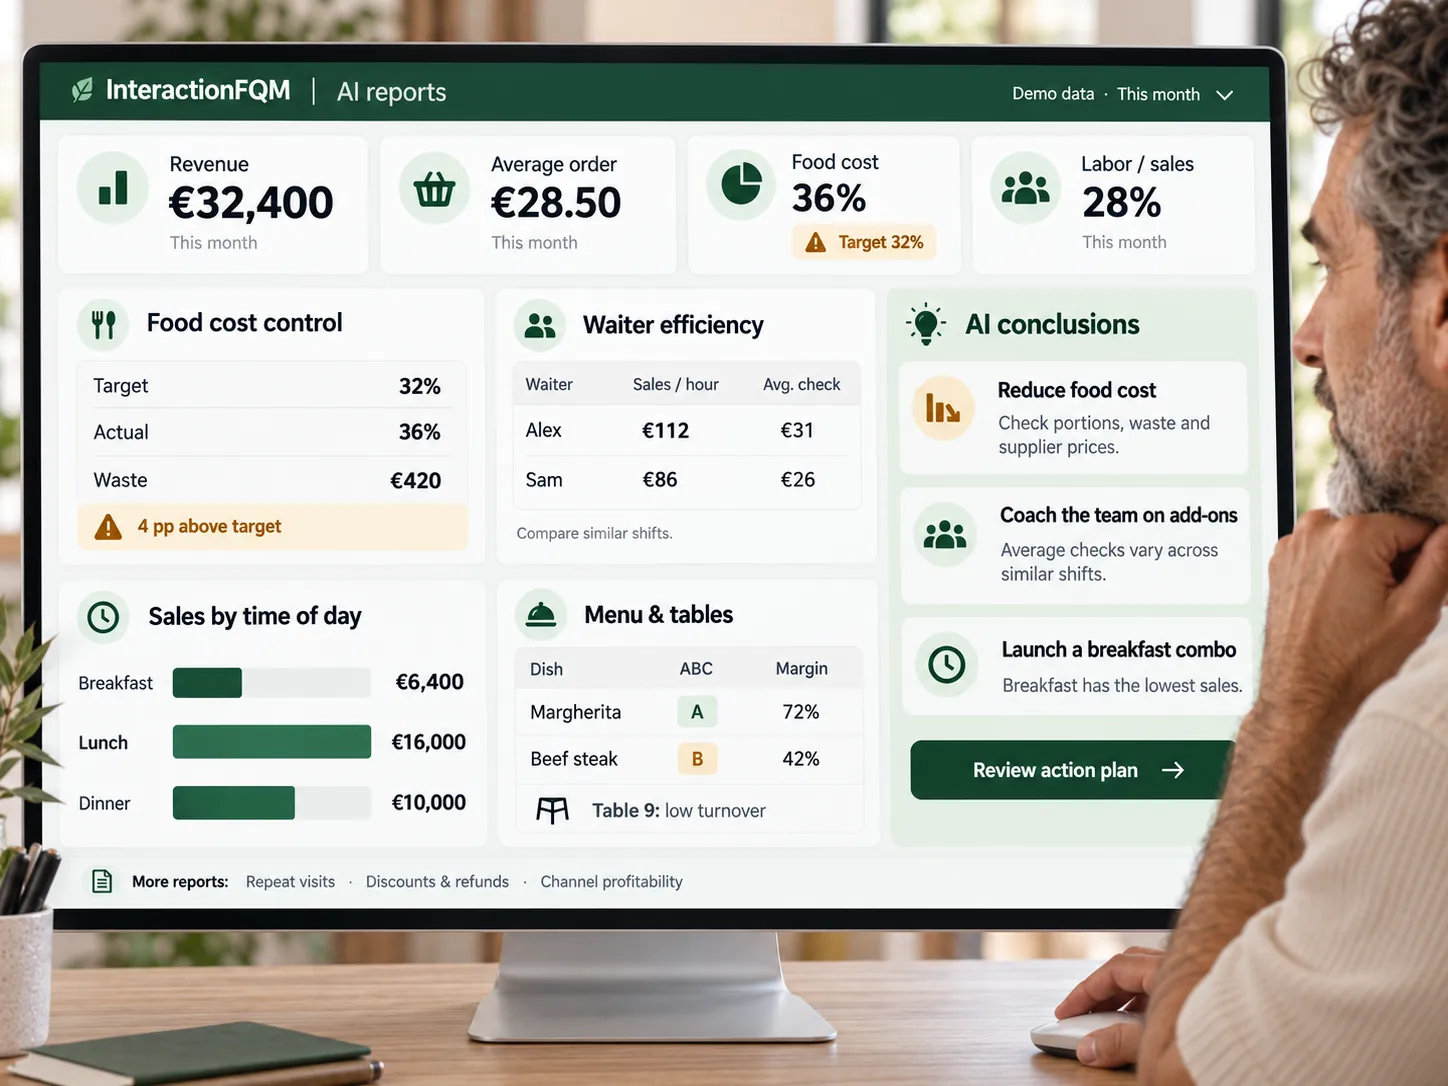
  • Tips by table and waiter
  • Waiter rankings with links to their tables and bills
  • Shifts for the selected period, with each shift on a separate row
  • Service time and average time guests spend at a table
  • Personal analytics dashboard for each waiter

Menu, demand and food costs

  • Complete daily list of dishes sold, with ABC classifications for dishes, tables and views
  • Menu and dish views by day and hour, and orders by hour
  • Inventory: stock levels, usage, forecasts, stocktakes, purchasing, write-offs and suppliers
  • Recipe cards and dish costs
  • Recipe-based costs and write-offs help you assess dish costs.

Reports for owners and restaurant groups

  • View individual venues or the entire group; mobile access and export for every chart
  • A dedicated dashboard page that can be shown on a screen
  • Daily and weekly reports for the owner via Telegram at a scheduled time
  • Shift cash report with print and export options
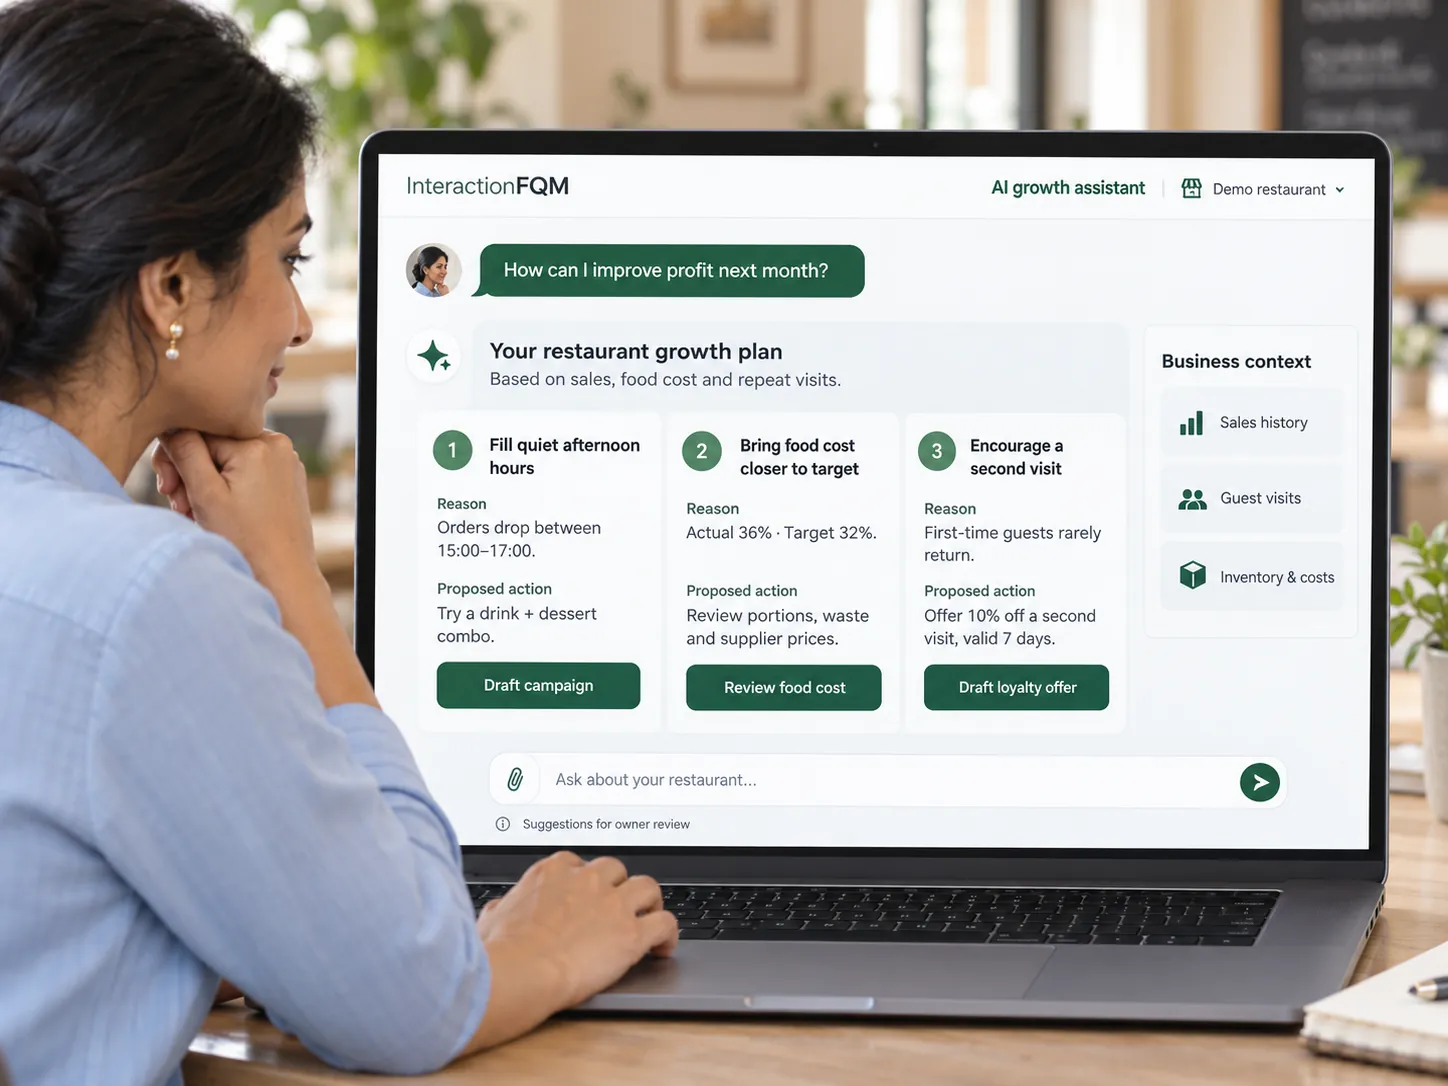
  • AI chart analysis: strengths, weaknesses and suggested actions
  • Daily and weekly reports by email

Setup and conditions

  • Data sources and connected modules
  • Business-day cutoff
  • Recipients of scheduled reports

Frequently asked questions

Are tips included in dashboard revenue?

In the report described here, revenue excludes tips; tips are accounted for separately.

Is there an automatic planned-versus-actual food-cost comparison?

The features described here cover recipe-based costs and write-offs. Automatic analysis of all variances is not included.

See how it works for your venue

We will review your processes, demonstrate the features you need and help you choose modules. Setup and team training are free. Test the solution for 14 days, then decide whether to move to a paid plan.

Book a demo

Works with this product

See how the platform can work for your venue

In 20 minutes, we will show the features relevant to your business and answer your questions. Then we can discuss a 14-day free trial, with no deposit or obligation.

Book a demo